

How to Read Battery Report Results on a Windows Laptop
Learning how to read battery report results was one of the first things I did after my refurbished Zephyrus G16 arrived. On a used laptop, the battery is the part most likely to be worn out. Today mine holds 85.5% of what it held new, which feels steep for a battery that’s mostly lived under a charge limit.
The report itself only takes a few seconds to make, but it opens as a wall of tables with no explanation. Below is what each part means on a real laptop and which labels are easy to misread. You’ll also see how to tell if your battery is aging faster than it should.
After I lined up my G16’s numbers, full charge capacity against design capacity was the only line that told me how worn the battery really is (76,974 mWh out of 90,005 mWh). The cycle count only showed a dash, and my 80% charge limit didn’t lower either number.
- Zephyrus G16 (GA605WI)
- Ryzen AI 9 HX 370
- Windows 11 Home 26H2
- powercfg /batteryreport
Build 26300.9974 · MyASUS 80% charge limit
How to make your battery report
The battery report is built into Windows, so there’s nothing to download, and it works on any Windows 10 or 11 laptop, not just ASUS ones. It’s a single command that saves an HTML page you open in your browser, and it’s the same command Microsoft points you to on its battery care page.
- Right-click the Start button and click Terminal (or search cmd and open Command Prompt).
- Paste the command below and press Enter.
- Windows answers with the path it saved the file to, like the line in the purple box below.
- Press Win + R, paste that path, and press Enter to open the report in your browser.
powercfg /batteryreport
Mine saved straight into my user folder as battery-report.html, which is where yours will land too unless you tell the command to save it somewhere else.
How to read battery report numbers that matter
The report is long, but the part that actually answers how healthy your battery is sits right at the top under Installed batteries. Out of everything on that table you’re going to care about 2 lines, plus a 3rd that might not even show up for you (it didn’t for me).

Design capacity vs full charge capacity
Design capacity (the purple box) is how much energy the battery was built to hold when it was new, and on my G16 that’s 90,005 mWh, which is milliwatt-hours, so you can think of it as a 90 Wh battery. Full charge capacity (the blue box) is how much it can actually hold right now if you charge it all the way, and mine was down to 76,974 mWh. The gap between those 2 numbers is the wear, and it only grows as your battery gets older.
How to work out your battery health
To turn that into a health percentage, divide full charge capacity by design capacity and multiply by 100. For me that’s 76,974 ÷ 90,005 × 100, which lands at about 85.5%, and it’s the one number to look at first whenever you read battery report results on any laptop.
Honestly, 85% felt quite steep to me, since I’ve had the battery health 80% mode on for the majority of my time with this laptop, meaning it’s been sitting at 80% instead of 100% most of the time. It has been dying a lot more often since I got to college though, so I can’t say I’m surprised.
Battery report not showing cycle count
A lot of guides tell you to check the cycle count too (roughly how many full charges the battery has been through), but on my G16 that line just shows a dash, in the orange box above, and the serial number shows a dash as well. The raw data behind my report stores the count as 0 in every weekly row going back to March, so this laptop’s battery simply never hands Windows a number to show.
I don’t really use cycle count as a metric anyway. It would be useful to have, but it’s not the end of the world, because full charge capacity already tells you how worn your battery is. So if yours shows a dash too, nothing is broken, and the health percentage from the section above is the number to go by.
What an 80% charge limit does to the report
If you use a charge limit like I do, you might expect full charge capacity to drop to about 80% of the battery, but the limit only changes how far your battery charges, not how much Windows thinks it can hold. Full charge capacity in my report never dropped anywhere near 80% of the battery while the limit was on.
Where the limit does show up is the charge level itself. On Nov 12 my G16 stopped charging at 61,601 mWh, which is 79.8% of the 77,165 mWh it could hold that day, and Windows’ own Power & battery page showed the same thing, 80% with Smart charging is on (the purple box below).

My limit is set in MyASUS right now. While I was testing Armoury Crate for a few weeks I had deleted G-Helper, and Armoury Crate had no setting for it, so the battery went right back to charging to 100%. If you’re deciding between 60%, 80% and 100% on your own laptop, I compared all 3 in which ASUS charge limit to pick.
Battery report explained past the first table
The top table is a snapshot of today, and the 2 tables further down are what tell you the story behind it, so they’re worth the scroll.
Battery capacity history
Scroll down to Battery capacity history and you get full charge capacity week by week, which is a lot more useful than a single reading because you can see exactly when your battery aged, and it’s the part of learning how to read battery report data that most guides skip.
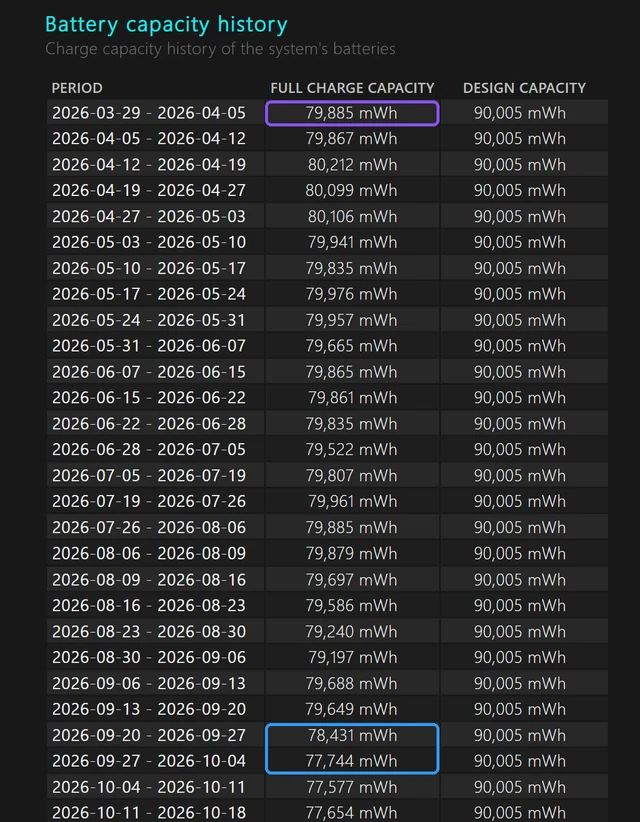
My history starts the week of March 29 at 79,885 mWh (the purple box), so the battery was already at about 88.8% of design capacity in the very first week Windows recorded it. From there it barely moved for months, sitting between about 79,200 and 80,200 mWh until mid-September, then it dropped to 78,431 and 77,744 mWh over the next 2 weeks (the blue box). Around that same stretch I had just started college, and the laptop was dying a lot more often than it used to.
I pulled the weeks that matter into the table below, each one measured against that first week Windows recorded, so you can see how small the normal ups and downs are next to the real drop.
| Week | Full charge capacity (mWh) | Health |
|---|---|---|
| Mar 29 (first record) Baseline | 79,885 | 88.8% |
| Apr 12–19 (highest) | 80,212 +0.4% | 89.1% |
| Sep 20–27 | 78,431 −1.8% | 87.1% |
| Sep 27–Oct 4 | 77,744 −2.7% | 86.4% |
| Nov 13 (today) | 76,974 −3.6% | 85.5% |
Microsoft’s battery care page recommends keeping a laptop roughly between 20% and 80% and avoiding frequent deep drains, so if your history shows a sudden drop like mine, it’s worth thinking about what changed in how you’ve been using it around that week.
What does Suspended mean in a battery report
The Recent usage table lists every power change from the last 7 days. Active means the laptop was on, Connected standby means it was asleep (that’s the Modern Standby sleep newer laptops use, which Microsoft explains on its Modern Standby page), and Suspended is the one the report never explains.
When I matched my rows against the Windows event log, every Suspended row lined up with the laptop powering down or hibernating. The 3 restarts on Nov 11 showed up as Suspended, so did the night I hibernated with shutdown /h on Nov 13, and so did a night where my G16 slept for an hour before switching itself to hibernate. Plain sleep that ended with me opening the lid stayed as Connected standby every time.
| Label in Recent usage | What it lined up with on my G16 |
|---|---|
| Active | The laptop was on and in use |
| Connected standby | Normal sleep (lid closed, woke by opening it) |
| Suspended | Restarts, hibernate, and sleep that switched itself to hibernate |

In my Nov 6 rows above, you can see the laptop sitting at 100% on the charger back when I had no limit (the purple box), a drain from 92% down to 6% in under 2 hours on battery (the blue box), and a Suspended row at 9:05 PM (the orange box). If your battery drops a lot during the Connected standby rows instead, that’s sleep drain, and I measured how much battery my G16 lost asleep overnight.
Is the Windows battery report accurate
Once you know how to read battery report numbers, the next question is whether you can trust them, and mostly you can, but don’t read too much into a single number. The figures come from the battery’s own gauge (a small chip inside the battery that estimates its charge), and that gauge drifts. In November alone my daily full charge capacity bounced between 76,466 and 77,165 mWh from one day to the next, and one morning after hibernating, the charge reading was 446 mWh higher than when the laptop shut off, even though nothing was charging it.
Because of that, the weekly history matters more than any one reading. A drop that sticks for weeks, like mine in late September, is real wear, while a few hundred mWh up or down from day to day is just the gauge. And if your problem is a battery that empties fast every day rather than one that’s wearing out, that’s usually software, which is what I tracked down in my Armoury Crate battery life test.
When you should check yours
I think everyone should check their battery health when they first get a laptop. It doesn’t just show if you got a dud, it also gives you a baseline for later, so you can actually see how your own habits are affecting your battery’s health.
Since I bought mine refurbished, it was one of the first things I checked, and I still open it every so often to make sure the way I’m using it isn’t hurting the battery, because realistically the battery is the one thing that’s going to decide how long this laptop lasts me.
FAQ
Where is the battery report saved?
By default it saves to your user folder as C:\Users\<your name>\battery-report.html, and the command prints the exact path when it finishes, so you can copy it from there.
Can I save the battery report somewhere else?
Yes, add /output and the path you want, and Windows saves it there instead of your user folder. This one puts it straight on the C drive:
powercfg /batteryreport /output "C:\battery-report.html"Does the battery report show my charge limit?
No, there’s no line for it. The only sign is in Recent usage, where the charge stops around your limit instead of reaching 100% (mine stopped at 79.8%).
If you ran yours, drop your laptop model, design capacity and full charge capacity in the comments (plus roughly how old it is), and I’ll tell you how it stacks up against my G16’s 85.5%.